Nashville will truly thrive when every student, no matter where they live in our community, has access to a high-quality school and an outstanding education.
As a city, we have not yet accomplished this goal. But for some Nashville families, the best possible educational fit for their student comes in the form of a public charter school.
When a city can provide several high-performing public school options – whether traditional, magnet, or charter – families benefit. But good, clear information about these options is essential if parents are to make the best, most informed school choice for their students. That is why the Scarlett Family Foundation seeks to equip parents, educators, elected officials, and community leaders with data-driven insight into Nashville’s public schools.
Last year, we released our Charter School Profiles – a data resource that provides comparable, straight-forward information on our city’s charter schools. Using these profiles, families and community members can quickly and easily take a look at a school’s academics, culture, and demographics.
(We also created the MNPS Cluster Pathway Profiles, which follow a student’s educational journey along each cluster pathway in Nashville’s traditional, zoned public schools.)
We are committed to making this resource relevant and useful to the community for many years to come. In that spirit, we are pleased to announce that our Charter School Profiles have been updated to reflect data from the 2018-2019 school year – the most recent data available. These updated profiles also include new measurements of College and Career Readiness for our high school charter schools. You can explore and compare each school’s updated profile here.
As more Nashville families look to options outside their traditional neighborhood school, it is more important than ever that data-rich educational resources be accessible to them. In the 2018-2019 school year, 15.5% of Nashville’s 81,407 students attended charters schools. This is a slight increase from the 14% of students who attended charter schools in the previous year.
Key Takeaways about Nashville’s Public Charter Schools
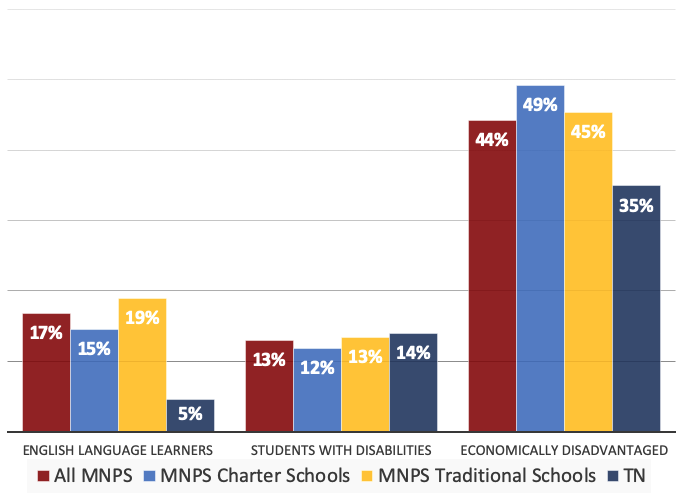
Demographics
Nashville’s charter schools continue to closely reflect the overall student population and demographics of the city. Although Nashville’s charter schools have a slightly lower percentage of English Language Learners and students with disabilities than Metro traditional schools, our local charter schools do enroll a higher percentage of lower-income, economically disadvantaged students.
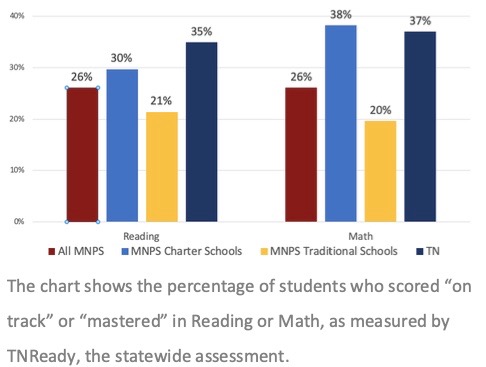 Achievement
Similar to last year’s profiles, Nashville’s charter schools scored, on average, higher in both Reading and Math than traditional schools. In the 2018-2019 school year, Nashville’s charter schools’ math achievement scores were higher than the Tennessee average.
College and Career Readiness
Nashville has five charter high schools. Because the majority of these schools are only a few years old, most have just begun to 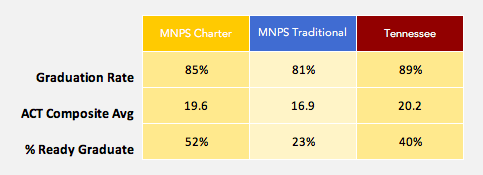 graduate students. In our updated profiles, we have added key metrics on college and career readiness to help evaluate how our charter high schools are performing in this area.
In the 2018-2019 school year, five of Nashville’s charter high schools reported composite ACT averages and two reported graduation rates and “Ready Graduate” percentages (a metric the State of Tennessee uses to determine college and career readiness). Students at Nashville’s charter high schools scored almost three points higher on the ACT, on average, than students at Nashville’s traditional high schools. However, the 19.6 ACT composite score is still below a 21, the widely accepted indicator for college and career readiness.
Culture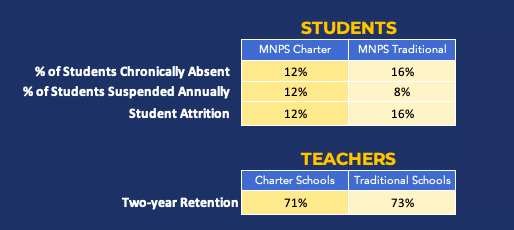
Continuing the trend seen last year, there are mixed results when looking at student attendance and school culture. Nashville’s charter schools have lower than average chronic student absenteeism and lower student attrition than Metro’s traditional public schools, but they also have higher average suspension rates and slightly higher teacher turnover.